For many members of the executive team, including the CISO, CIO, and CFO, the cybersecurity budget feels like a black hole.
Year after year the request for funding increases. You invest in more firewalls, more software, and more personnel. Yet the return on that investment remains invisible. Unlike a marketing budget that drives leads or an R&D budget that creates products, security spending often sits on the balance sheet as a pure cost center. It is frequently viewed as an expensive insurance policy against a disaster that might never happen.
The Insurance Model of cybersecurity is now obsolete.
A digital first economy demands that cybersecurity is no longer just about preventing bad things from happening. It is about Business Resilience. This is the ability of your organization to continue generating revenue, serving customers, and maintaining operations while under pressure.
The question the Board should be asking is no longer "Did we block the hackers?" The right question is "How much revenue did our resilience strategy save us this quarter?"
Shifting the metric from Prevention to Resilience makes the ROI clear, calculable, and undeniably positive. This article outlines how to measure that value in terms that every board member understands, including downtime, recovery speed, and financial risk reduction.
Why Attacks Blocked is a Vanity Metric
A common mistake occurs when security leaders present their quarterly reports to the Board. The presentation is often filled with slides showing massive numbers. You might report that the firewall blocked 10 million malicious packets or that the antivirus quarantined 500 potential threats.
These are what we call Vanity Metrics.
They look impressive on a surface level because the numbers are large. However, they fail to communicate any real business value to a C-Level executive. Telling a CEO that you blocked 10 million attacks often creates more confusion than confidence. It raises questions like "Is 10 million good or bad?" or "Does this mean we are safe or are we being targeted more than usual?"
The Problem with Activity Based Reporting
Tracking the number of attacks blocked is measuring activity rather than outcome. It is like a goalkeeper in football telling the coach how many times they jumped during the game. The coach only cares about how many goals were scored against the team.
For the Board the only thing that matters is the "goals" that get through. If you block 99.9% of attacks but the one remaining attack takes down your payment gateway for 24 hours the previous millions of blocks are irrelevant to the financial health of the company.
The Strategic Disconnect
When you focus on these operational numbers you inadvertently position cybersecurity as a technical problem rather than a business risk. This makes it difficult to justify budget increases. If the report shows you are successfully blocking millions of threats the CFO might argue that the current budget is sufficient.
To prove ROI, you must stop reporting on how busy the security team is. You must start reporting on how resilient the business is. This requires a shift from counting technical incidents to measuring business outcomes.
The Three Metrics That Actually Measure Value
To speak the language of the Board you must translate technical risk into financial reality. There are three key metrics that bridge this gap. These numbers prove that your security strategy is actively protecting the bottom line.
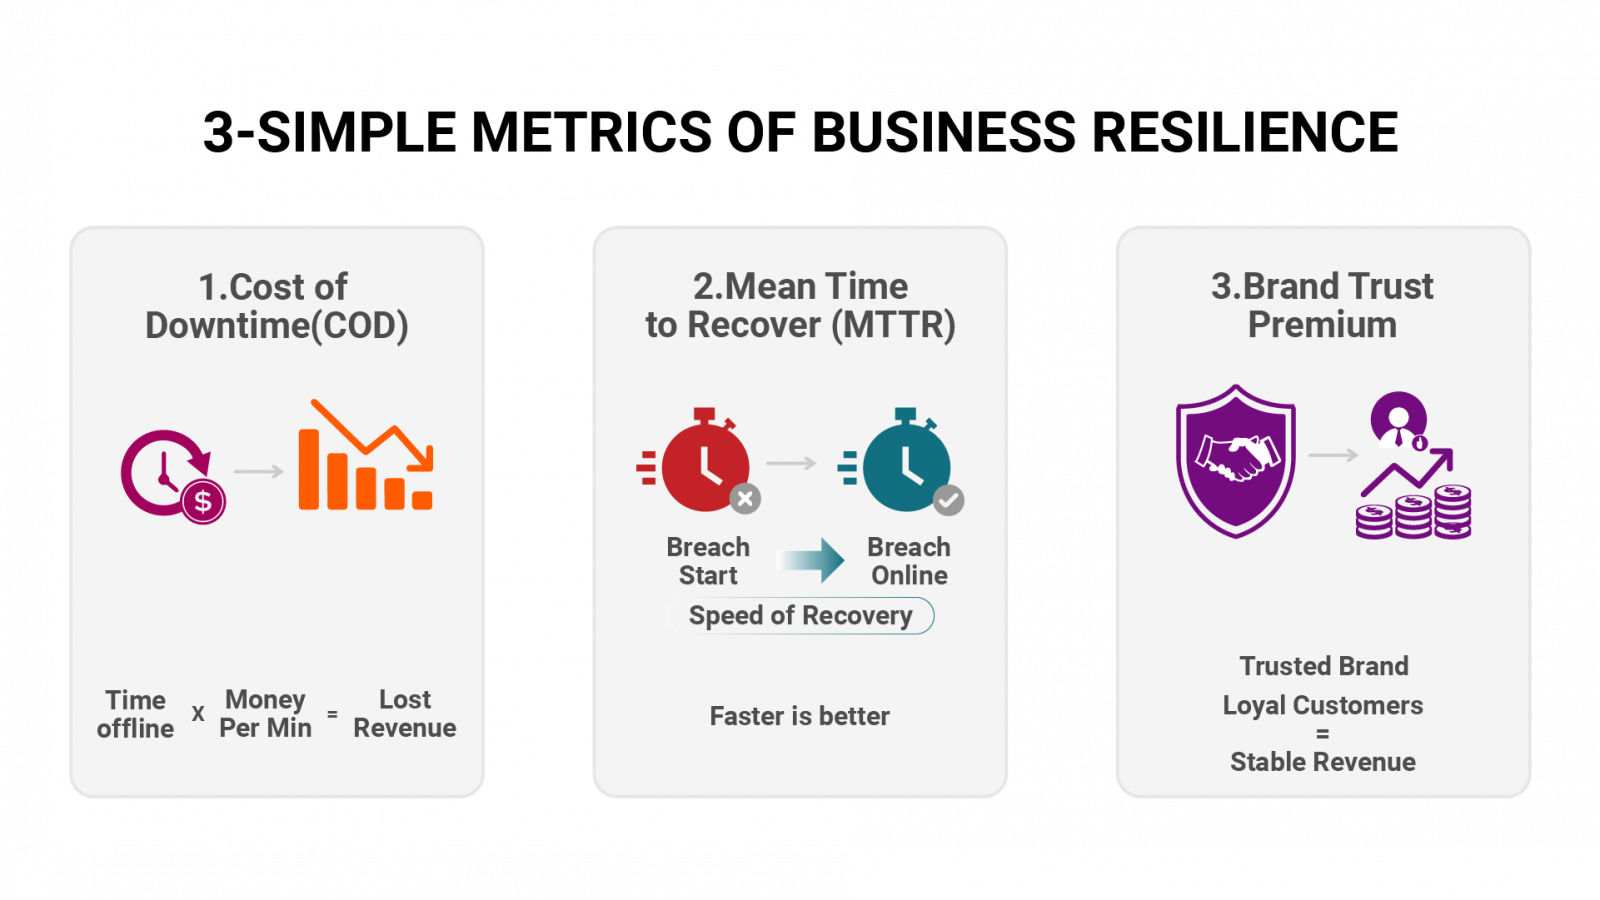
1. Cost of Downtime (CoD)
This is the single most powerful metric for justifying a cybersecurity budget. It answers a simple question. How much money does the company lose for every minute our systems are offline?
You calculate this by combining lost revenue, employee productivity loss, and recovery costs.
For example, if an e-commerce platform generates 10,000 dollars per hour and a ransomware attack takes the site down for 4 hours, the direct cost is 40,000 dollars. If your resilience strategy includes a premium backup solution that restores the site in 30 minutes, you have effectively saved the company 35,000 dollars in a single incident. That saving is your ROI.
2. Mean Time to Recover (MTTR)
In a resilience model we accept that attacks will happen. The measure of success is speed. Mean Time to Recover tracks how long it takes to restore full business operations after a breach occurs.
A lower MTTR proves that your organization is resilient. It demonstrates that you have invested in the right incident response tools and training. When you present this to the Board you are showing them that the organization is becoming more agile and harder to disrupt. It turns a potential disaster into a minor inconvenience.
3. Brand Trust Premium
Customer trust is a tangible asset. In the modern market customers will abandon a brand that loses their personal data. Resilience protects the Customer Lifetime Value (CLV).
You can measure this by tracking customer churn rates after a security incident compared to industry averages. A resilient company that communicates clearly and recovers quickly will retain customers while a slow reacting company will lose them. This retention of revenue is a direct return on your security investment.
The ROI Formula for the Boardroom
To present a compelling case you need a mathematical framework. Relying on fear or technical jargon will not unlock the budget you need. Instead we use the Annual Loss Expectancy or ALE model. This turns abstract risk into concrete numbers that can be compared against other business investments.
The Calculation Logic
The formula is straightforward. You calculate the probable financial loss of an incident and compare it against the cost of preventing it.
You begin by defining the Single Loss Expectancy (SLE). This is the total monetary loss from a single event, such as a ransomware attack. It includes the Cost of Downtime, legal fees, and recovery expenses.
Next you determine the Annual Rate of Occurrence (ARO). This is the likelihood of that event happening in a year.
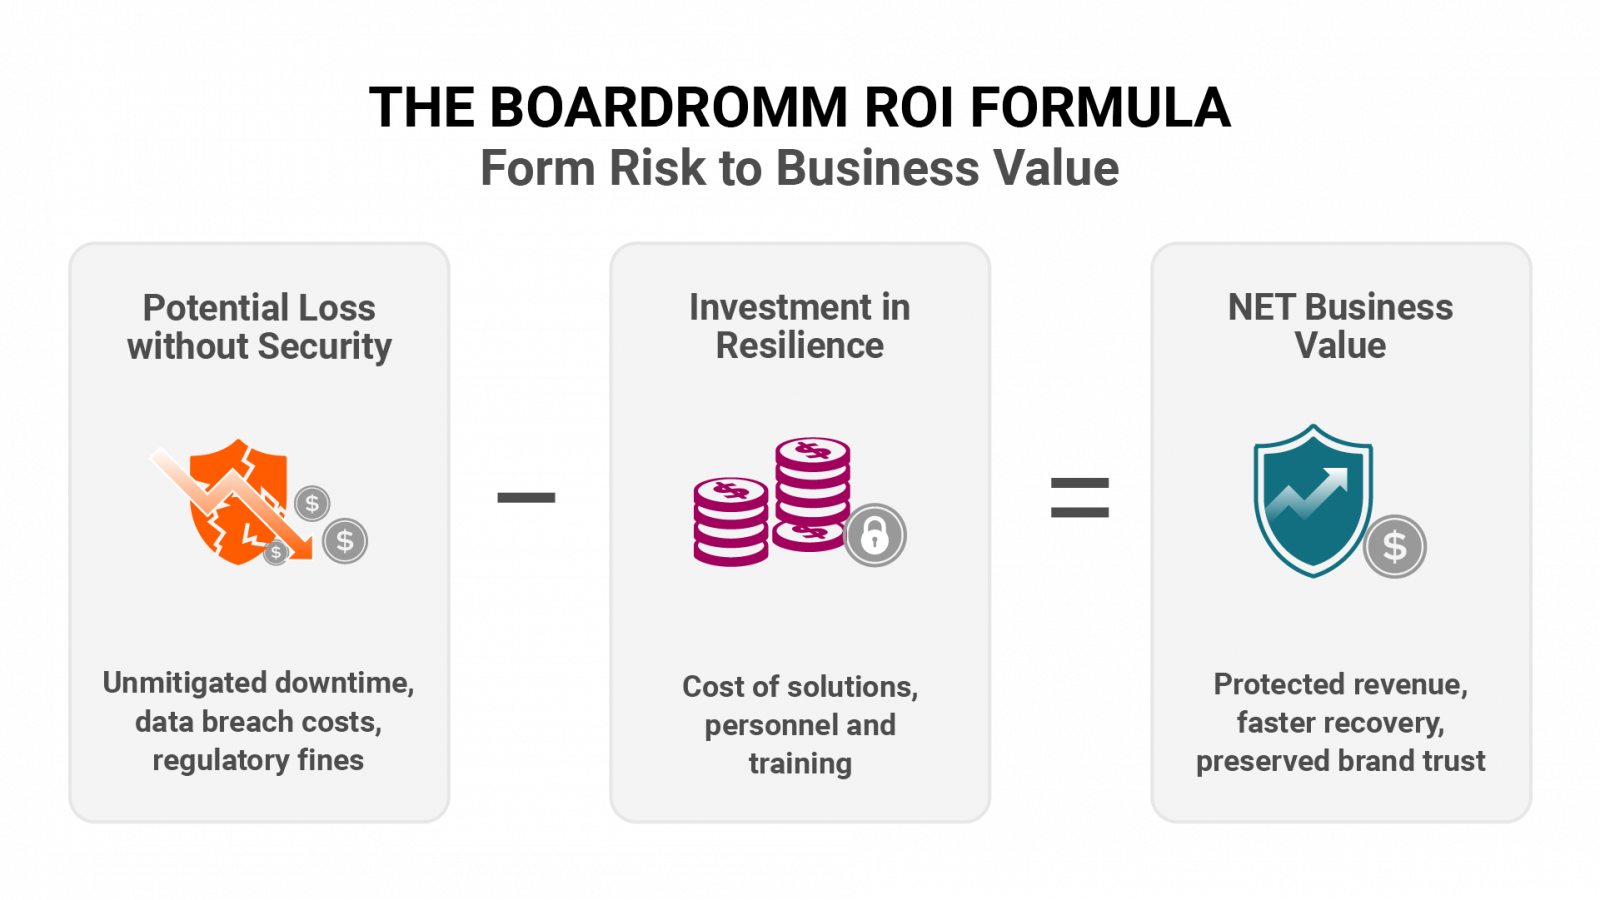
The ROI Equation
To find the Return on Investment you compare the potential loss before your security measure is in place against the potential loss after it is implemented. The formula looks like this:
(Potential Loss Without Security) minus (Potential Loss With Security) minus (Cost of Solution) equals Net ROI
A Practical Example
Imagine your assessment shows that a data breach would cost the company 2 million dollars. Based on industry trends the likelihood of this happening is 10% this year. That means your annualized risk exposure is 200,000 dollars.
You propose a new Zero Trust solution that costs 50,000 dollars. This solution effectively reduces the likelihood of a successful breach from 10% down to 1%.
Your new risk exposure is only 20,000 dollars.
By spending 50,000 dollars you have removed 180,000 dollars of risk exposure. This is a net value of 130,000 dollars to the business.
When you present the data this way you are no longer asking for money. You are offering a business deal with a guaranteed return.
Building a Business First Dashboard
The final step in proving value is changing how you visualize success. Most security dashboards are built for engineers. They display technical details like patch rates, server loads, and vulnerability counts. When a CEO looks at this they see noise rather than signal.
To communicate effectively you need to build a Business Resilience Dashboard. This display should focus exclusively on metrics that impact the health of the organization.
What to Include
Your executive dashboard should highlight three specific areas.
First it must show Business Uptime. This tracks the availability of critical revenue generating systems. It tells the Board that the digital doors are open for business.
Second it should display Risk Exposure Reduction. Instead of listing vulnerabilities you show the financial value of the risks you have mitigated this quarter. This directly correlates your budget to money saved.
Third it must track Compliance Health. This is a simple status indicator showing that the company is meeting its legal and regulatory obligations. This assures the Board that they are protected from fines and legal action.
The Clarity of Red Yellow Green
Executives do not have time to decipher complex graphs. Use a simple traffic light system. Green means business operations are secure. Yellow indicates a rising risk that is being managed. Red signals a critical threat to revenue. This allows the Board to assess the state of the company in seconds.
Conclusion: Resilience is a Competitive Advantage
It is time to change the narrative around cybersecurity. For too long it has been viewed as a tax on doing business. It was seen as a necessary burden to keep the lights on.
A mature organization understands that strong cybersecurity is actually a competitive advantage. Companies that can survive a cyber-attack and keep trading have a distinct market edge over those that crumble. When you can prove to your customers that their data is safe and your services are reliable you build trust that competitors cannot match.
Security is not just about staying safe. It is about staying in business. By measuring and reporting on Business Resilience you shift the conversation from cost to value. You empower the C-Suite to make informed decisions that protect both the reputation and the revenue of the company.
Frequently Asked Questions:
1. Can you actually measure the ROI of cybersecurity?
Yes. While you cannot measure the "absence of an attack," you can measure the Cost of Resilience. You calculate ROI by comparing the cost of a security investment against the potential financial loss (downtime, legal fines, brand damage) it prevents. If the cost of the solution is lower than the Annual Loss Expectancy (ALE) of the risk, the ROI is positive.
2. What is the most important metric for a CISO to present to the Board?
The most important metric is Business Risk Exposure. The Board needs to know how much financial risk the company is currently carrying and how the security budget is reducing that number. Vanity metrics like "number of viruses blocked" do not provide this context.
3. How do you calculate the Cost of Downtime?
The Cost of Downtime is calculated by adding Lost Revenue (sales per hour × hours down) + Productivity Loss (employee salaries / hours idle) + Recovery Costs (IT overtime + external consultant fees).
4. What is the difference between Compliance and Resilience?
Compliance means you meet the minimum legal requirements (checking the boxes). Resilience means your business can survive a cyber attack and continue operations. You can be 100% compliant and still go out of business from a ransomware attack; resilience ensures you stay in business.
5. Why is Mean Time to Recover (MTTR) a financial metric?
MTTR is a financial metric because every minute of downtime has a direct dollar cost. Reducing your MTTR from 4 hours to 30 minutes directly saves the company 3.5 hours of lost revenue and wasted salary. This saving is the tangible return on your incident response investment.